5 Crypto Analysis Tools to Understand Market Trends

The cryptocurrency is highly volatile, with price changes occurring within minutes. In this type of environment, traders need proven strategies to generate profits from their trades consistently. One helpful approach is trend trading, which focuses on identifying the general direction of a coin’s price movement and taking positions that follow that pattern. Real-time analysis tools make this process easier by providing live data and indicators that enable traders to act with greater confidence and precision.
Market Trends in Crypto Trading
A cryptocurrency market is trending when prices move steadily in one direction over time. There may be short-term pullbacks, but the market usually returns to its main direction.
When prices rise consistently, the market is in an uptrend. This type of trend shows higher highs and higher lows as buyers continue to dominate. When prices move downward over time, the market is in a downtrend. In this case, sellers have more control, and the price forms lower highs and lower lows.
The idea of demand and supply explains these movements. When demand for a cryptocurrency is strong and supply is limited, buyers are willing to pay more, pushing prices higher. On the other hand, when supply exceeds demand, prices tend to fall as sellers lower their prices to attract buyers.
Trend traders use crypto analysis tools to determine if a token is establishing new highs and lows, indicating an uptrend, or if the cryptocurrency is marking lower highs and lows, signalling a downtrend. Spotting these patterns early can make all the difference in preserving portfolio value and identifying profitable opportunities. Here are five top crypto analysis tools and how to use them to understand market trends in real time:
Top 5 Crypto Analysis Tools
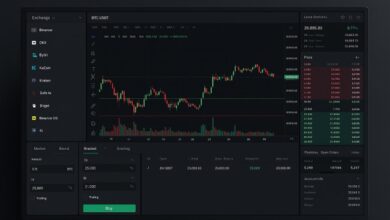
TradingView: Best for Technical Chart Analysis
TradingView is usually the first go-to crypto research tool for many traders and investors. Built to interact in real time with crypto exchanges through several API systems, TradingView provides the most updated cryptocurrency price charts. From the price charts, traders can identify common candlestick patterns to confirm market trends. For example, suppose a small red candle is followed by a larger green candle that completely engulfs it. In that case, it may signal a reversal from a downtrend to an uptrend, commonly known as the bullish engulfing candlestick pattern.
TradingView also offers a range of trend analysis tools to complement and confirm candlestick patterns. These include over 100 technical indicators, such as common ones like the Moving Average, Relative Strength Index (RSI), and Moving Average Convergence Divergence (MACD). For instance, when the RSI is below 30, it signals that a token is oversold and the price is nearing exhaustion with the potential for a rebound. However, when the RIS exceeds 70, it indicates that a token is overbought, suggesting an upcoming downtrend in momentum.
The charting platform also features drawing tools for trend analysis, like trend lines, Gann Fans, and Fibonacci retracement (Fib). Fib has three critical levels: 38.2%, which indicates a shallow pullback with the possibility of a price rebound; 50%, showing indecision and a signal to stay out of the market; and 61.8%, which is a strong confirmation that the price will likely reverse if it holds at that region. By combining these indicators and tools, users can gain a clear picture of how and why a token is trending upward or downward and plan their entries or exits more strategically.
DefiLlama: Best for Tracking DeFi and Ecosystem Growth
DefiLlama is a crypto analytics tool for tracking the value of protocols’ total value locked (TVL) metric. TVL is crucial for investors, as it provides insights into their confidence in a project and the level of liquidity. A higher TVL suggests that more liquidity is present, making it easier for DeFi transactions, such as swapping, without resulting in significant price slippage.
Users also have the opportunity to view ETF inflows over the last 24 hours, allowing them to track institutional moves and gain insights into trends that significantly impact the markets. DefiLlama also features a stablecoin market cap, which investors can use as a complementary tool to track any positive or negative correlation between stablecoins and other assets, such as gold and Bitcoin.
Coinglass: Best for Tracking Real-Time Trading Activities and Liquidations
Coinglass is another top analysis platform that provides real-time data on open interest, liquidations, and a full suite of crypto tools. The open interest indicates the number of contracts currently outstanding in the cryptocurrency market. A rising open interest, corresponding with rising prices, suggests that more money is entering the market on the long side. When open interest is growing but prices are falling, it means more money is entering the market on the short side. Using open interest data, investors can detect if the market is in or may continue to be in an uptrend or a downtrend.
DappRadar: Best for Discovering dApp and NFT Trends
DappRadar is an extensive crypto analytics platform that allows traders and investors to gain insights into trends in token and NFT marketplaces. While NFTs may seem like a thing of the past, blockchain data, especially from platforms like DappRadar, indicates that the space remains active. DappRadar provides information on trends in NFT trading, including the floor price, market capitalisation, 24-hour volume, and number of traders, to help investors identify worthwhile potential NFT assets.
DappRadar also provides an overview of decentralised apps, real-world assets, and tokens, including information on the number of unique active wallets and token growth. DappRadar also generates industry reports quarterly, helping investors understand the cryptocurrency market.
TokenInsight: Best for Curated Research and Expert Analysis
Compared to other crypto analysis tools that primarily feature numerical data, TokenInsight provides more expert-derived reports on crypto tokens and current market trends. The platform offers a daily digest that contains the latest news articles, market analysis reports by professional in-house and external researchers, and specialised reports covering deep dives into protocols, exchanges, tokens, and the general crypto market.
Finding What Works Best
Traders do not need to master every analysis tool to succeed. Each platform offers unique insights, but real progress comes from focusing on the one that matches personal trading habits and comfort. Consistency with a single, reliable tool often yields better results than switching between multiple tools without a clear plan.