Dow Jones Futures Performance: Reading the Numbers That Matter
Few tools are as influential as Dow Jones futures when assessing market sentiment before the stock market opens. These contracts, which reflect the anticipated performance of the Dow Jones Industrial Average, provide real-time insight into how traders and institutions expect the U.S. market to behave. Understanding Dow Jones futures performance is crucial for those seeking to make smart, informed trading decisions.
The numbers behind the movement – such as pre-market change, daily percentage shifts, and reaction to economic data – are far more than just figures on a screen. They offer a live snapshot of risk appetite, global confidence, and market direction. A comprehensive Dow futures overview includes precisely tracking these metrics and interpreting them through the lens of current events and historical context.
What Dow Futures Performance Really Tells You
The performance of Dow futures is often the first indicator of investor sentiment. Since they trade nearly 24 hours a day, they capture the global reaction to economic data, geopolitical developments, and overnight news well before the stock market officially opens. A strong showing in Dow futures during pre-market hours often indicates a bullish sentiment, while weakness can signal early caution.
What makes Dow Jones futures performance especially important is the speed with which it reflects changing conditions. Traders use these futures as both a hedging instrument and a forecasting tool. When prices rise steadily during early sessions, it generally means investors are optimistic. However, if they drop sharply following news from abroad or a disappointing economic release, it signals concern.
The direction and strength of futures performance provide context for how the day might begin and the trading tone throughout the session. The market might have already priced in the information if futures remain stable after volatile overnight news. On the other hand, sustained movement in one direction is often a clue that momentum will carry through after the opening bell.
Using the Dow Futures Chart to Measure Performance
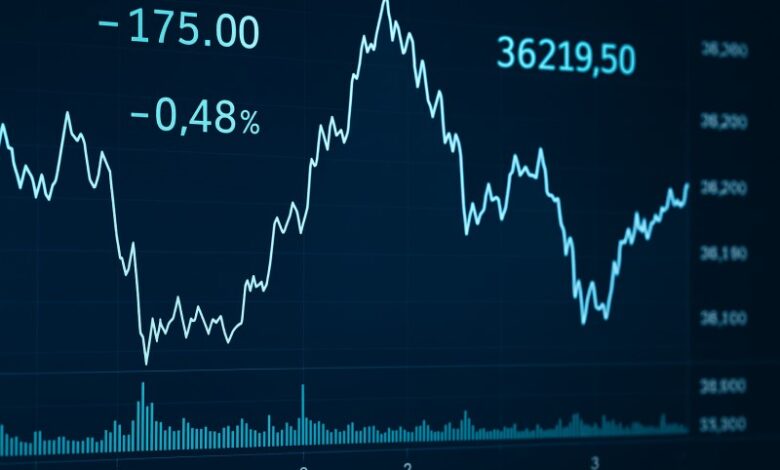
The Dow futures chart is essential for visualizing this performance. It allows traders to see patterns over time, compare real-time moves to past reactions, and identify potential turning points. Short-term charts show immediate price shifts, while longer timeframes provide a broader picture of trends and resistance levels.
By reading the chart carefully, traders can identify whether the performance is part of a sustained trend or a temporary fluctuation. For example, a steady climb over several sessions that aligns with improving economic data may represent a genuine bullish trend. A sudden spike that immediately retraces may indicate overreaction or low-volume manipulation.
Performance data becomes even more meaningful when combined with technical indicators. Trendlines, moving averages, and volatility ranges offer added layers of confirmation that help traders decide whether to trust what they see on the chart. Consistency in Dow Jones futures performance over multiple sessions indicates higher conviction among market participants.
Contextualizing Dow Futures Overview with Key Numbers
A proper Dow futures overview goes beyond daily moves. Traders and analysts assess market tone by looking at weekly and monthly performance. Performance data is often reviewed in the context of economic reports, earnings seasons, and geopolitical developments.
Suppose Dow futures consistently respond similarly to certain data types, such as rising after jobs reports or declining during rate hike fears. In that case, those patterns become part of a trader’s decision-making toolkit. Knowing how the market reacts under specific conditions allows for more confident positioning.
It’s also important to monitor futures performance relative to other indices. If Dow futures outperform while S&P 500 or Nasdaq futures lag, it may suggest a rotation into value or industrial stocks. These relative moves help paint a broader picture of market structure and priorities.
Conclusion
Understanding Dow Jones futures performance is about more than just numbers. It’s about reading the signals behind those numbers and putting them into proper market context. By following the Dow futures chart, recognizing recurring patterns, and maintaining a disciplined Dow futures overview, traders and investors can gain an early advantage in anticipating market movement.
In volatile markets where news can shift sentiment in seconds, a strong grasp of futures performance can mean the difference between reacting late and positioning ahead of the curve.